

What Is a False Breakout Strategy in Forex and Gold Trading?
| DefinitionA false breakout strategy is a trading approach that identifies and responds to price moves that cross a support or resistance level but fail to continue and then return inside the previous range. Instead of entering every breakout candle, this approach uses higher-timeframe structure to filter which breakouts have structural backing — and which ones are setups for the wrong side of the trade. |
You will hear the failed move called a fakeout, failed break, breakout trap, or liquidity sweep. The setups differ, but the result is the same: traders entered, and the price went the other way. Investopedia’s overview of breakout trading identifies false breakouts as one of the most consistent reasons technically valid setups produce losses — price crosses the level, entries fill, then the move reverses.
The false breakout strategy in this post starts with one rule. Before you look at the 15-minute chart, check the Daily. Before you look at the 5-minute chart, check the 4H. The small chart times entries. The big chart decides whether those entries make any structural sense.
| Key Takeaways • A false breakout happens when the price crosses a level but fails to continue, trapping traders who entered on the initial move. • The lower timeframe shows the temptation. The higher timeframe shows the trap. • This false breakout strategy uses a three-tier hierarchy: Daily (environment), 4H (structure), 15M/30M (execution only). • A retest is not a false breakout — they are different pattern that require different responses. • Automated execution can embed higher-timeframe structure into every trade, removing the behavioral failures that make false breakout traps so expensive. • No framework removes risk, slippage, or drawdown. This approach filters low-quality setups — it does not eliminate them. |
Why Breakout Traders Keep Getting Trapped
The 15-minute chart looks like where the action is. Candles move fast, setups appear obvious, and there is a pull to the pace of it that I understand completely. That is also where most traders consistently give their money to the market.
The problem is not that breakouts do not work. It is the sequence traders use to analyze them.
They start on the small chart and trust it as the full picture
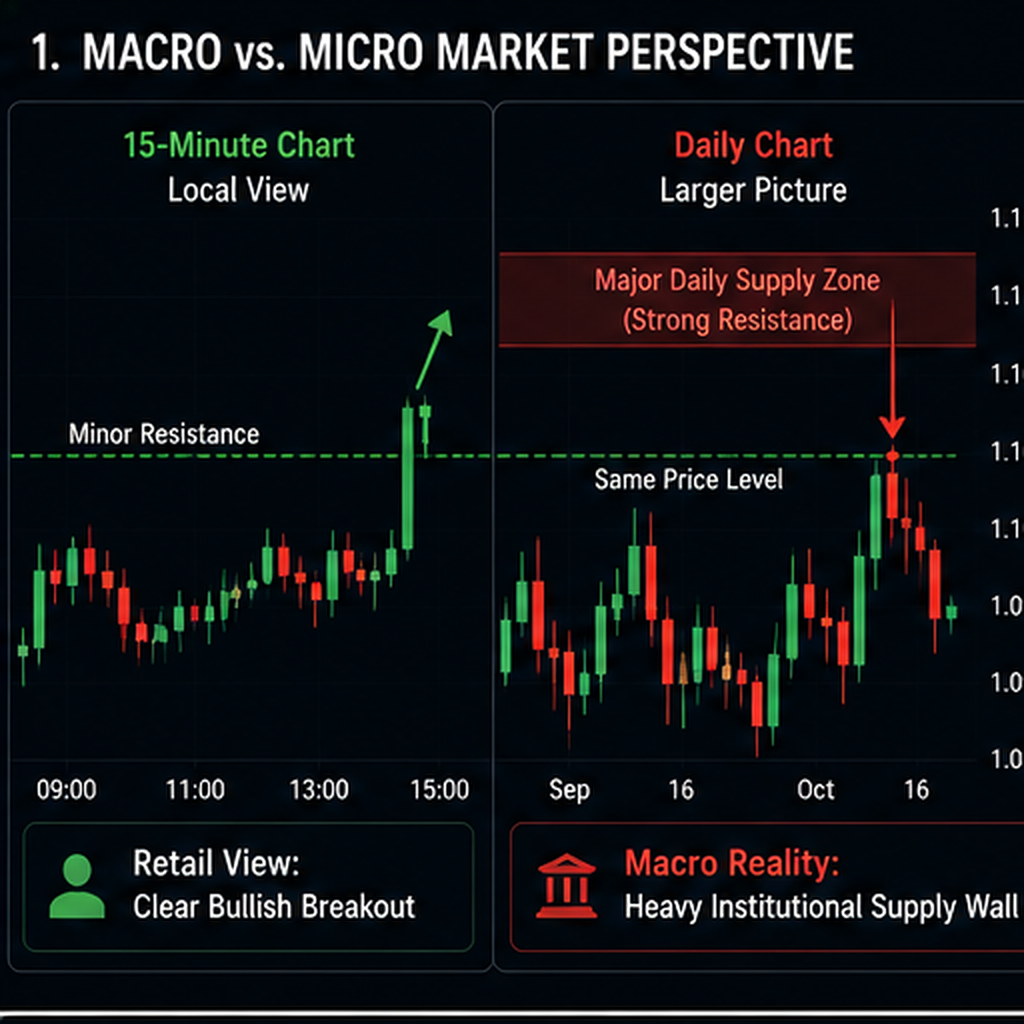
A breakout on the 15-minute chart can be technically valid on that timeframe and completely irrelevant on the Daily. Price can push above a local resistance level while sitting directly below a major Daily supply zone. On the small chart, it looks like a clean continuation. On the Daily chart, it is running straight into a wall. That is not a setup. That is where breakout entries become liquidity for the other side.
They enter before the market shows follow-through.
Many traders enter the moment the price crosses a level — no candle close, no retest, no check on whether the 4H structure has actually changed. A conviction built on the 15-minute chart is one of the fastest ways to lose capital on a recognisable setup. BabyPips covers the reasoning behind multiple-timeframe analysis and why reading the lower frame in isolation leads to consistent loss across different strategies and market conditions.
They confuse liquidity collection with trend continuation
Institutions and central banks do not make decisions based on 5-minute candles. They operate on Daily and Weekly levels, and they frequently push prices through obvious highs and lows because retail orders are clustered there. Breakout entries, stop-losses, and pending orders all sitting at visible levels get triggered and absorbed — then the price reverses because the reason for the push has already been fulfilled.
Think of it this way: a false breakout is the market opening a door wide enough for traders to rush in, then slamming it shut behind them. The entry orders triggered at those levels become fuel for the institutional move in the opposite direction. Understanding that mechanism is the foundation of any effective false breakout strategy.
The 4H/Daily Chart First Rule Explained.
This rule changes the starting point of your analysis. Most traders monitor lower timeframes and check higher ones when uncertainty builds. This rule inverts that sequence: begin on the Daily chart, move to the 4H, and only use the lower timeframe once the higher-timeframe case is already made.
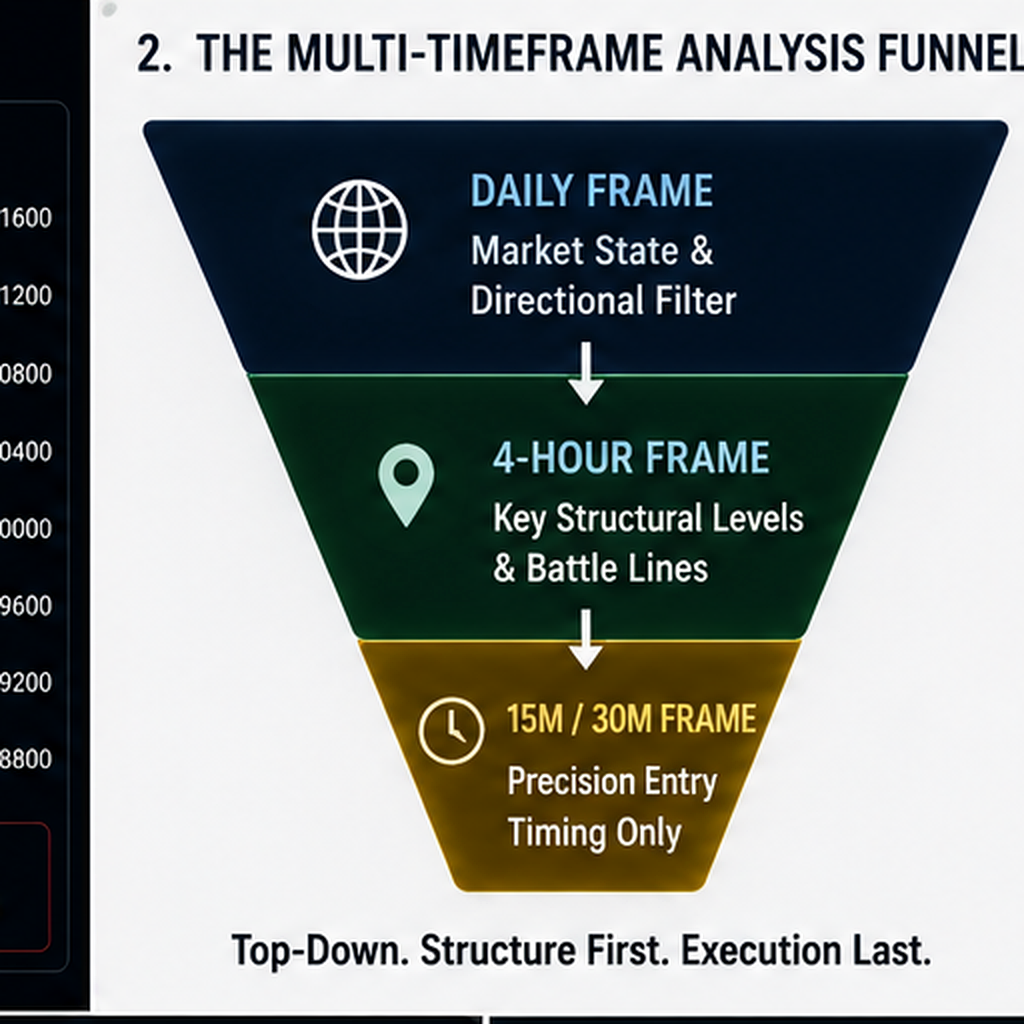
Daily Chart: Environment
The Daily chart tells you whether the market deserves your attention in a given direction. Before any trade, classify the market into one of four states:
- Bullish trend: higher highs and higher lows, price above key structure
- Bearish trend: lower highs and lower lows, price below key structure
- Range-bound: price oscillating between clear support and resistance without sustained direction
- Unclear/transition: recent structure break with no confirmed new trend — caution required
A bullish breakout inside a confirmed Daily uptrend and a bullish breakout moving directly into Daily resistance are not the same trade. They look identical on a 15-minute chart. On the Daily, the difference is immediate and obvious.
The Daily chart decides whether the breakout deserves attention.
4H Chart: Structure
The 4H chart bridges the big-picture direction from the Daily and the execution logic on the lower timeframe. It tells you whether the breakout has structural backing or is just candle activity without context. CFI’s guide on support and resistance levels explains how significant price zones form and why they carry weight across multiple timeframes. On the 4H, you are identifying meaningful swing highs and lows, break-and-retest zones, compression points where price is building before a move, 4H supply and demand areas, whether price is trending or trapped in chop, and liquidity sweep zones where stop-losses and entries cluster.
No 4H structural confirmation, no breakout permission. That is the rule.
Lower Timeframe: Execution Only
Once the Daily environment supports the direction and the 4H structure confirms the setup, the lower timeframe has one job: refine the entry. Use it to find the precise entry point, set the invalidation level, confirm whether a retest held, and assess whether volatility is stable enough for a clean fill.
The 15M or 30M chart can time the trade. It cannot authorise the trade.
The False Breakout Decision Matrix
The goal is not to predict every breakout. It is to stop giving equal trust to unequal setups.
| Daily Chart | 4H Chart | LTF Breakout | Decision |
| Bullish trend | Breaks 4H resistance and retests | Bullish breakout | Higher-quality long setup |
| Bullish trend | Still below 4H resistance | Bullish breakout | Wait — structure not confirmed |
| Bearish trend | Rejecting 4H supply | Bullish breakout | High-risk bull trap |
| Range-bound | Choppy 4H structure | Any breakout | Avoid or wait for a clean retest |
| Bearish trend | Breaks 4H support and retests | Bearish breakout | Higher-quality short setup |
Use this matrix before entering any breakout trade. If the Daily and 4H columns do not align with the direction of your entry, slow down.
How to Apply This False Breakout Strategy Step by Step
Step 1: Mark the Daily Bias
Open the Daily chart first. Classify the market into one of the four states above. A bullish breakout inside a Daily uptrend and a bullish breakout into Daily resistance are not the same trade. Marking the Daily bias stops you from treating them as equals before you even check the 4H.
Step 2: Mark the 4H Battle Line
The battle line is the 4H level price must break and hold before a lower-timeframe entry has any structural backing. This includes clear 4H swing highs or lows, range boundaries, supply or demand zones, and trendline compression points. If the lower-timeframe breakout has not cleared this level, there is no structural permission to trade.
Step 3: Wait for Break, Retest, or Failure
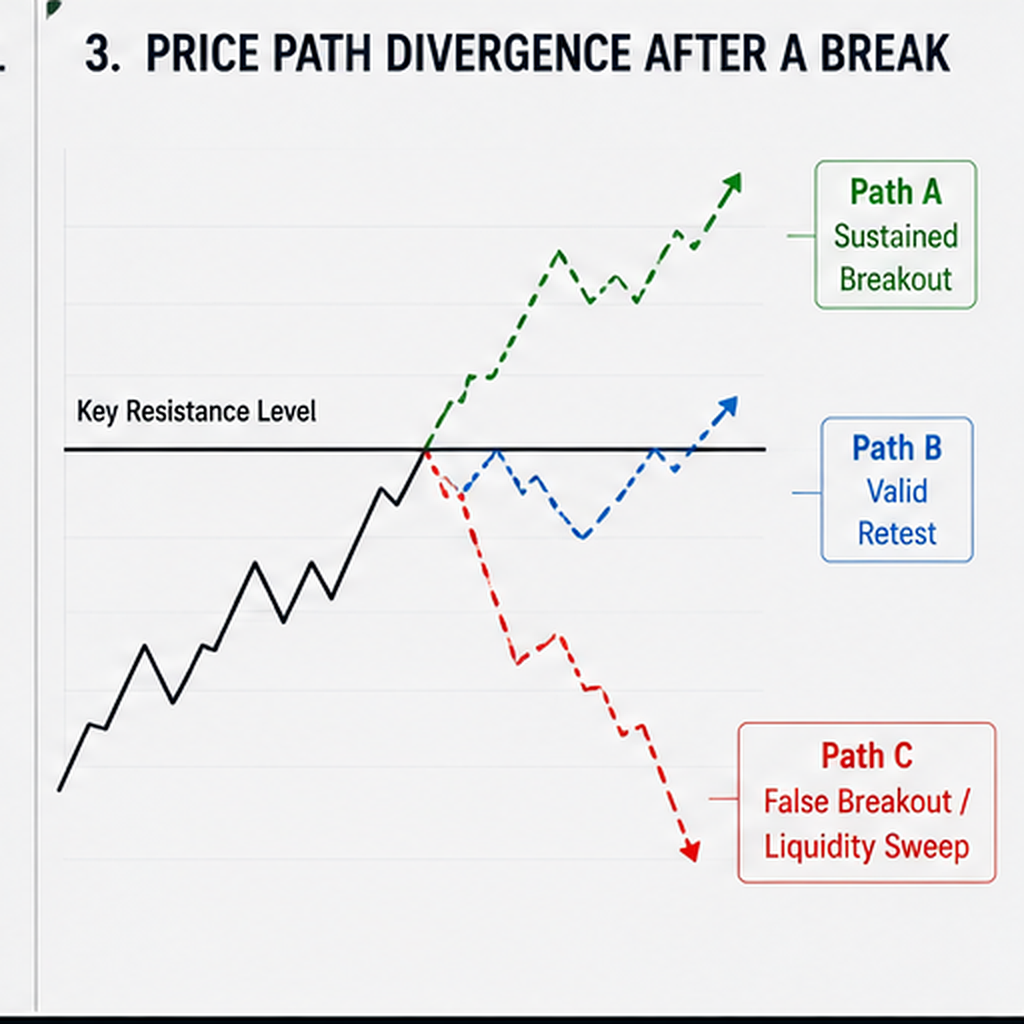
The first breakout candle is not a signal. It is the start of a test. After the candle closes beyond the level, watch whether price holds and shows continuation momentum, returns to retest the level and holds, rejects from the level, or falls back inside the old range.
A retest is not a false breakout. A retest returns to the level and may continue in the breakout direction. A false breakout fails to continue and retreats inside the prior structure. These are different situations that require different responses.
Step 4: Define the Invalidation Before the Entry
Every trade needs a clear point of contradiction. Before entering, answer: Where am I wrong on this trade? How much am I risking to find out? Is my stop placed beyond the structure, not at an arbitrary pip distance? Is the target realistic before the next higher-timeframe zone blocks the move?
A trade without a defined invalidation point is not a strategy. It is a reaction.
Real Breakout vs. False Breakout vs. Retest
| Pattern | What Happens | Trader Response |
| Real breakout | Price breaks the level and continues | Look for continuation or retest entry |
| Retest/throwback | Price returns to test the broken level, then continues | Wait for the level to hold before entering |
| False breakout | Price breaks the level, fails, and returns inside the range | Exit the breakout idea or consider a reversal setup |
| Liquidity sweep | Price runs through obvious highs/lows to trigger orders | Wait for reclaim or continuation confirmation |
Treating a retest and a false breakout as the same pattern is how traders end up in the wrong position twice on the same level. The distinction matters before entry, not after the trade is already open.
The False Breakout Warning Checklist
Run through this before entering any breakout trade. Multiple boxes checked is a signal to pause, not a signal to decide faster.
- Is the breakout fighting the Daily trend?
- Is the price breaking directly into 4H supply or demand?
- Did the candle close beyond the level but fail to continue?
- Did the price return inside the range quickly after the break?
- Is the breakout happening during low-liquidity hours?
- Is there a major news event nearby?
- Is the stop-loss too wide to justify the risk relative to the target?
- Am I entering because of structure — or because the candle looks exciting?
Example: Bullish Breakout or Bull Trap on XAUUSD?
Here is how this false breakout strategy reads in a real XAUUSD scenario.
Scenario: 15M Breakout Above Resistance
- Daily chart: Bearish trend. The price is approaching a major resistance zone.
- 4H chart: The 4H swing high has not broken. Price is still inside a broader bearish structure.
- 15M chart: A breakout candle closes above a local resistance level. The next candles fail to continue.
Interpretation
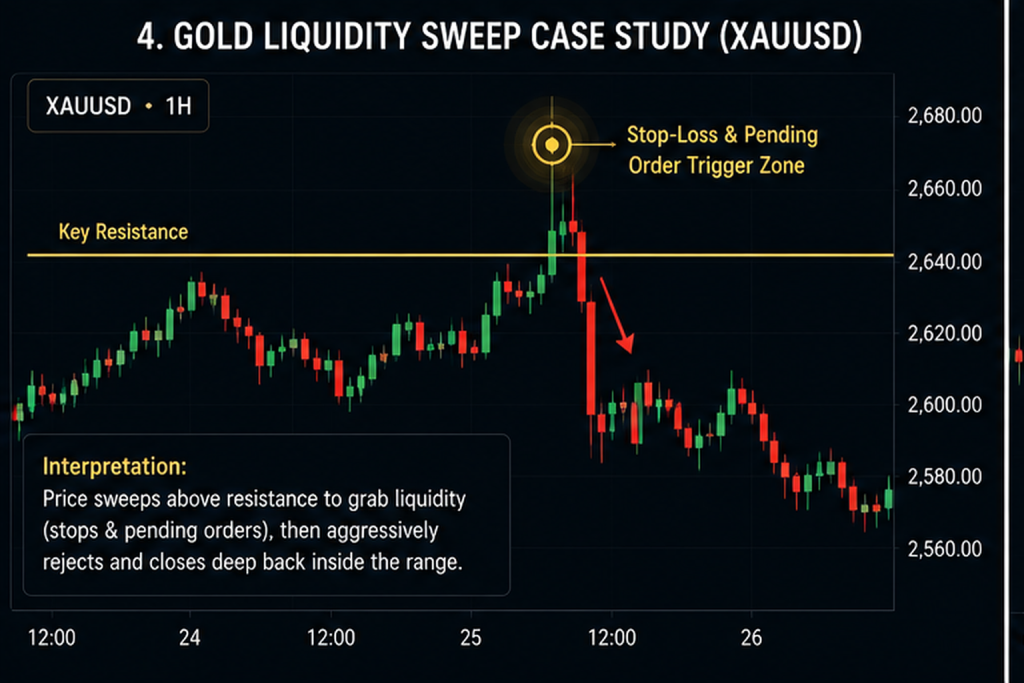
This is not a high-quality long setup. The Daily environment is bearish. The 4H structure has not confirmed. The 15M breakout is most likely a liquidity sweep collecting orders above a visible high. A trader who started on the 15M chart would have seen an opportunity. A trader who started on the Daily chart would have seen a warning.
The better approach: wait for either a clean 4H break and retest above the key level, or a failed breakout reversal back below the level to consider the short side.
Gold produces these setups consistently around high-impact events. You can track scheduled releases that create these conditions on Forex Factory’s economic calendar. The breakout can look completely convincing on the 15-minute chart. The Daily and 4H tell a different story within minutes.
Risk Management for the False Breakout Strategy
Use structure-based stops
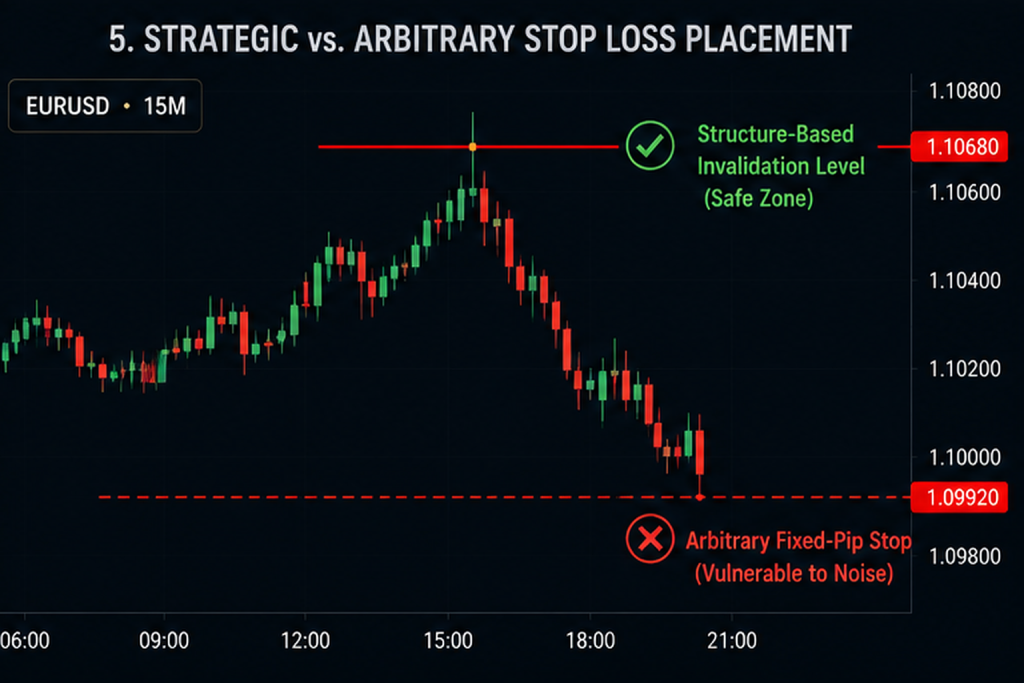
Stops placed at round numbers or arbitrary pip distances are predictable targets. Structure-based stops sit beyond the level that contradicts the entire premise of the trade. For a failed bullish breakout reversal, the invalidation sits above the sweep high. For a confirmed breakout continuation, it sits below the retested level.
If the stop required is too wide relative to your target, that tells you the setup is not ready — not that you need to tighten the stop.
Avoid revenge entries after a trap
False breakouts produce a sharp emotional reaction. You were on the right side of the candle. Price reversed. The temptation to re-enter immediately or flip and chase the reversal before it confirms is strong and almost always wrong. Re-entering without new structural confirmation is doubling the mistake.
Define a session-level kill switch
Account-level risk control is as important as individual trade management. Define how much total drawdown you will accept in a session, a day, or a week — and stop when you hit that number, regardless of confidence in the next setup. One trade should never turn into account damage.
Spread, slippage, and execution conditions
Around high-impact news, the execution environment changes fast. Gold spreads can expand significantly. Broker execution may be delayed. Slippage can move your entry or stop away from the expected price. Investopedia’s explanation of slippage covers why fast markets are where execution assumptions break down most often. A setup that looks clean on the chart may not execute cleanly when the candle is live.
How Automation Handles What Emotional Traders Miss
This is where the connection between a false breakout strategy and automated execution becomes direct and worth understanding clearly.
The false breakout trap is not primarily a market analysis problem. Most experienced traders know they should check the Daily first. They know to wait for 4H confirmation. They know revenge entries are expensive. They do it anyway — because when you are watching a fast-moving candle on the 15-minute chart, knowing the rule and following the rule are two different things. That gap between knowledge and action is the discipline gap. A well-built Expert Advisor closes it.
The Gold EA that JTS runs does not experience urgency when watching a breakout candle. It does not re-enter in frustration after being trapped. It does not adjust risk based on how the last three trades felt. The logic is defined before the market opens. Execution follows that logic regardless of how the live candle looks.
For false breakout behaviour specifically, this matters in three concrete ways:
| Manual Trader Behaviour | Automated EA Behaviour |
| Enters on the breakout candle before it closes | Requires close confirmation before entry triggers |
| Moves the stop-loss when the trade goes against them | Uses fixed invalidation points set in advance by strategy logic |
| Skips 4H/Daily check when deep in the 15M chart | 4H and Daily conditions are hard-coded requirements, not preferences |
| Re-enters after being trapped — revenge trading | No emotional state — logic stays fixed regardless of prior trade result |
| Adjusts risk based on how the last few trades felt | Risk parameters set before the session, not during live exposure |
None of this removes the need to understand the false breakout strategy first. It actually increases that need. If you build or purchase an EA without understanding why breakouts fail at specific levels, you end up with an automated system that enters the same traps a manual trader would — just faster and across more accounts simultaneously. Myfxbook’s public performance data consistently shows a performance gap between EAs with defined structural filters and those operating on pure indicator-based entries. The reason is almost always the same: without higher-timeframe filtering in the entry logic, the EA cannot distinguish a real breakout from a trap.
Understanding this false breakout strategy gives you two things: a better manual filter for live decisions and the foundational knowledge to evaluate whether an automated system is built to avoid these traps — or just capable of entering them more efficiently.
When to Sit Out Instead of Trading the Breakout
Knowing when not to trade is part of the strategy. Sit out when:
- The Daily chart is unclear or in a transition phase
- The 4H chart is ranging without a clean, readable structure
- The breakout candle is too large for clean stop placement within your risk tolerance
- Price is breaking directly into higher-timeframe resistance or supply
- The move is happening immediately before or after a major news release
- You cannot clearly state where the trade is invalidated
- You are entering because you feel like you are about to miss a move
A missed breakout is cheaper than a forced one. Far cheaper.
Final False Breakout Strategy Checklist
Before executing any breakout trade, confirm each of the following:
☐ Daily chart defines the environment. Bias is clear.
☐ 4H chart confirms the structure. The battle line is identified.
☐ Lower timeframe is used only to refine entry timing.
☐ Retest behaviour observed — not just the initial breakout candle.
☐ No 4H structure confirmation = no trade.
☐ No invalidation point = no trade.
☐ No defined risk = no trade.
What This Means for You
False breakouts happen because traders let the smallest chart make the biggest decision. Starting on the 15-minute chart and working upward feels efficient. It is backwards. The 15-minute chart shows what is happening right now. The Daily chart shows what matters.
This false breakout strategy creates one simple hierarchy: Daily for environment, 4H for structure, lower timeframe for execution timing only. That sequence will not remove losses from your trading — no framework can. But it stops you from treating every breakout candle as permission and starts filtering setups through a structure that tells you when the risk makes sense and when the better move is to wait.
If your manual execution is already disciplined, understanding the logic behind this false breakout strategy also gives you a stronger foundation for evaluating any automated system. The rules that make a manual trader more consistent are the same rules that should be hard-coded into any EA before you trust it on a live account.
Frequently Asked Questions
What is a false breakout strategy?
A false breakout strategy is a trading framework that identifies and responds to breakouts that fail — where price moves through a support or resistance level but reverses before continuing. Depending on the setup, traders either avoid the trap entirely or trade the reversal that follows. Higher timeframe structure is the primary filter.
What is a false breakout in forex?
A false breakout in forex happens when the price moves beyond a support or resistance level but fails to continue and then returns inside the previous range. This traps traders who entered on the initial move. You will also hear it called a fakeout, failed break, or breakout trap.
How do you avoid false breakouts?
Check the Daily and 4H charts before the lower timeframe, wait for a candle close beyond the level before considering entry, watch for retest behaviour rather than acting on the first breakout candle, and avoid setups where the breakout direction runs against the higher-timeframe trend. BabyPips covers multiple timeframe analysis in detail — a useful reference for understanding how structure at higher time frames affects the quality of lower-timeframe breakout setups.
What is a liquidity sweep, and is it the same as a false breakout?
Not always. A liquidity sweep is a price move through obvious highs or lows to trigger the orders sitting there. After those orders are absorbed, the price may reverse — but it can also continue. A false breakout fails to hold the broken level. A liquidity sweep may simply reset before the true continuation follows. Investopedia’s price action guide explains how institutional order flow around key levels differs from retail breakout activity.
Is a retest the same as a false breakout?
No. A retest returns to the broken level and may continue in the breakout direction. A false breakout fails to continue and moves back inside the previous structure. These are different patterns that require different responses. Treating them the same is how traders end up in the wrong position twice on the same level.
What timeframe is best for breakout trading?
Use the Daily chart for market environment, the 4H chart to confirm structure, and the 15M or 30M chart for entry timing only. Entry on the lower timeframe should only happen after the higher-timeframe case is already established.
Can this strategy work on XAUUSD?
Yes. Gold frequently produces sharp intraday breakout failures, and liquidity sweeps around key levels, particularly around high-impact news events. The 4H/Daily structure-first approach is especially relevant for XAUUSD because Daily and 4H supply and demand zones carry significant weight on this instrument. Risk controls remain necessary regardless of the framework used.
Can trading bots apply a false breakout strategy?
Yes. A well-built Expert Advisor can be coded to require higher-timeframe conditions to be satisfied before entry logic fires. This removes the behavioural failures — early entries, revenge trades, skipped confirmation steps — that make false breakout traps so costly for manual traders. Whether an EA performs well depends on the position sizing logic, drawdown limits, entry conditions, and account mode compatibility.
What is the difference between a false breakout and a breakout failure?
They describe the same event from different angles. A false breakout describes how the price moved — it appeared to break but reversed. A breakout failure describes the outcome — the directional continuation did not materialise. Both terms point to the same setup: price crossed a level, traders entered, and the move reversed.
Risk Disclaimer
Trading forex, gold, and crypto carries a significant risk of loss and is not suitable for all participants. Past performance is not indicative of future results. Only allocate capital you can afford to lose. No false breakout strategy, trading framework, or automated system guarantees profit or removes the risk of loss.